Do AI engines and Google show buyers the same sources when they search pricing queries like “X pricing”, “how much does X cost” or “cheapest X”? In this sample, more than at any other stage of the funnel, though they still differ on the supporting cast. I am Andrii Byzov, an AI-native fractional CMO and GEO consultant for B2B SaaS, and I ran 44 high-commercial-intent pricing queries across 10 software categories through Google (pulled via Apify), ChatGPT and Perplexity. The headline: per-query overlap between AI-cited domains and Google’s top 10 averaged about 54%, the highest of the buyer intents I have measured. Pricing is where generative engine optimization (GEO) and search engine optimization (SEO) agree most, but the vendor’s own page does the heavy lifting on both sides.
Key takeaways
- For 44 pricing queries, per-query overlap averaged about 54%, versus 16% for segment, 22% for “best X” and 33% for comparison queries. Pricing is where Google and AI agree most.
- Pricing triggers fewer AI Overviews: present on 33 of 44 queries (about 75%), below 91% for “best X” and 97% for comparison.
- Across the set, 147 unique domains ranked in Google’s top 10, 85 were cited by AI, and 40 overlapped.
- AI leaned on vendor pricing pages and review sites: top AI-cited were techradar, amplitude, mixpanel, hubspot, zendesk, intercom, mailchimp and semrush.
- Google leaned on community and procurement help: top Google-ranked were reddit (dominant, 36), youtube, spendflo, wise, vendr and userpilot.
- Solid scope: both ChatGPT (40 of 44, 91%) and Perplexity (39 of 44, 89%) answered about 90% of the queries, a robust two-engine sample.
This does not mean SEO and GEO have merged at the bottom of the funnel. It means that when a buyer is checking what something costs, both surfaces gravitate toward the same authoritative source (usually the vendor) more than they do for discovery or comparison searches.
How pricing intent compares to discovery and comparison
I have now run the same overlap analysis across three buyer intents on largely separate datasets, and the pattern is consistent: the further down the funnel the query sits, the more the two surfaces agree.
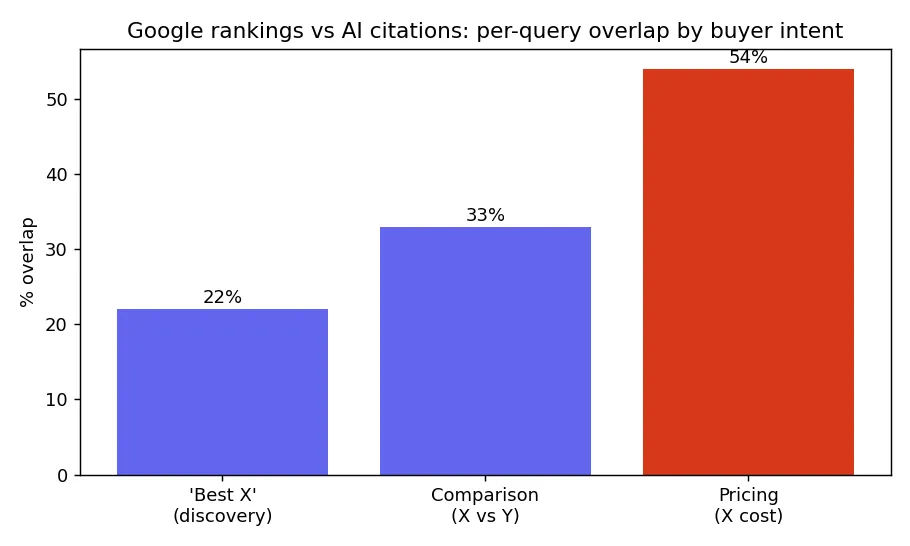
In my GEO vs SEO benchmark, per-query overlap for broad “best X” discovery queries averaged about 22%. For comparison and alternative queries it rose to about 33%. For these 44 pricing queries it reached about 54%.
Why would that be? When someone asks “how much does X cost”, there is usually one canonical answer, and it lives on the vendor’s own pricing page. Both Google and the AI engines reach for that page, which mechanically lifts the overlap. Discovery and comparison queries have no single right answer, so the two systems fan out and agree less. Even at 54%, this is not full convergence: roughly four in ten of the sources AI cites for a pricing answer are still not in Google’s top 10 for that query.
Pricing triggers fewer AI Overviews
Here is the cross-intent twist that surprised me. You might expect higher commercial intent to trigger more AI Overviews, but I found the opposite.
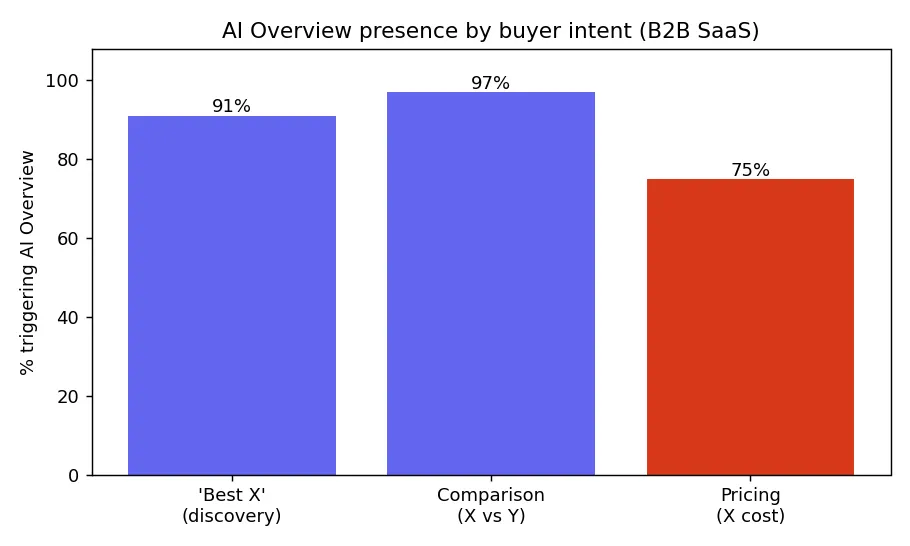
An AI Overview was present on 33 of 44 pricing queries, about 75%, lower than the 91% I saw for “best X” and the 97% for comparison queries. Pricing triggers fewer Overviews, not more.
My working explanation, and it is a hypothesis rather than a finding, is that pricing answers often sit on a single authoritative page. When the best answer to “X pricing” is the vendor’s own pricing page, Google may serve that direct organic result rather than synthesizing an Overview. Discovery and comparison queries invite synthesis because no single page settles them; pricing queries point at one obvious destination. Two caveats stand: AI Overview presence is not the same as which sources get cited, and this is one US snapshot, so the gap could narrow on a re-run.
AI leans vendor pages, Google leans Reddit and procurement
Look at who dominates each side and the convergence story gets more textured. The surfaces agree on the type of source that matters most (the vendor), but their supporting sources diverge sharply.
| Side | Top sources for pricing intent | Character |
|---|---|---|
| AI-cited | techradar (5), amplitude (5), mixpanel (5), hubspot (4), zendesk (4), intercom (4), mailchimp (4), semrush (4) | Vendor pricing pages plus review sites |
| Google top 10 | reddit (36), youtube (12), spendflo (8), wise, vendr (5), userpilot | Community, video and procurement help |
The AI side is almost entirely vendor pricing pages (Amplitude, Mixpanel, HubSpot, Zendesk, Intercom, Mailchimp and Semrush all publish clear, structured pricing) plus review and round-up sites like TechRadar. That is a tidy result for vendors: in this sample, AI engines mostly quote your own pricing page back to the buyer.
Google’s set is broader and more community-driven. Reddit dominates, with 36 appearances, followed by YouTube. But the distinctive feature of pricing intent is the rise of procurement and negotiation sites: Spendflo (8) and Vendr (5) rank heavily, alongside tools like Wise and Userpilot. These sites help buyers benchmark and negotiate software spend, and they surface in Google for pricing far more than for discovery or comparison. Reddit’s strength echoes what I found in why Reddit dominates Google’s SaaS comparison results, now extended to the pricing stage.
So the directional read is: for pricing, the vendor’s own page is the asset that matters most on both surfaces, AI mostly cites that page directly, and Google adds a layer of community discussion and procurement-help sites on top. If you sell B2B SaaS, your pricing page is doing double duty as a GEO asset, a point I expand on in your pricing page is your GEO asset.
What this means for pricing-stage visibility
Pricing and decision-stage queries are where intent is highest, so visibility here has direct commercial weight. Three things follow from the data, in this sample.
First, the convergence is real but partial. At 54% per-query overlap, your Google work is more likely to carry into AI answers for pricing than for any other intent. But four in ten AI-cited sources still sit outside Google’s top 10, so I would not treat them as interchangeable.
Second, the vendor’s own pricing page is the highest-leverage page on both surfaces. AI mostly cites it directly, and a clear, well-structured pricing page (plain tiers, real numbers where you can show them, structured markup) plausibly helps both AI citations and Google rankings. This is also where your pricing model itself shapes how citable the content can be: opaque “contact us” pricing gives both surfaces little to quote.
Third, do not ignore the off-domain layer. Reddit threads and procurement sites like Vendr and Spendflo rank for your pricing in Google whether you participate or not, and that is where a lot of buyer sentiment about cost gets formed. Measuring both surfaces for your own pricing queries is the work I do as a fractional CMO and GEO consultant: see GEO and AI search optimization.
Methodology
I assembled 44 pricing-intent queries across 10 B2B SaaS categories: the high-commercial-intent set such as “X pricing”, “how much does X cost” and “cheapest X”. This is a new dataset, distinct from my “best X” and comparison benchmarks, so the three intents can be compared.
For the Google side, I pulled the top 10 organic results per query via Apify and recorded the ranking domains. An AI Overview was present on 33 of 44 queries, about 75%, though I scored organic domains, not the Overview itself. For the AI side, I ran each query through ChatGPT and Perplexity and recorded cited domains; ChatGPT answered 40 of 44 (91%) and Perplexity 39 of 44 (89%), so both engines answered about 90%, a solid two-engine sample. I then compared unique domains overall (147 Google, 85 AI, 40 overlapping) and computed per-query overlap, which averaged about 54%.
Be clear on the limits. This is directional, not definitive. AI Overview presence is a separate measure from which sources get cited. This is US context, one snapshot on a single date, and it excludes ads, maps and other result types. Numbers will move when I re-run it. I write more about GEO on LinkedIn.
FAQ
Do AI engines and Google agree on sources for SaaS pricing queries? More than for any other intent I have tested, in this sample. Across 44 pricing-intent queries, per-query overlap between AI-cited domains and Google’s top 10 averaged about 54%, versus 16% for segment, 22% for “best X” and 33% for comparison queries. Overall, 147 unique domains ranked in Google’s top 10 and 85 were cited by AI, with 40 overlapping. Pricing is where the two surfaces converge most, though they still pull from different supporting sources.
Why do pricing queries trigger fewer AI Overviews than other intents? In this sample an AI Overview was present on 33 of 44 pricing queries, about 75%, lower than the 91% for “best X” and 97% for comparison queries. My read is that pricing answers often live on a single authoritative page, the vendor’s own pricing page, so Google may lean on a direct organic result more often than synthesizing an Overview. This is directional, and AI Overview presence is not the same as which sources get cited.
Which sources dominate AI answers versus Google for pricing intent? In this sample, AI leaned on vendor pricing pages and review aggregators: top AI-cited were techradar (5), amplitude (5), mixpanel (5), hubspot (4), zendesk (4), intercom (4), mailchimp (4) and semrush (4). Google leaned on community and procurement help: top Google-ranked were reddit (dominant, 36 appearances), youtube, spendflo, wise, vendr and userpilot. Procurement and negotiation sites like Vendr and Spendflo rank heavily in Google but are largely absent from AI answers.
How complete is this pricing-query dataset? It is directional, not definitive. I ran 44 pricing-intent queries across 10 B2B SaaS categories. ChatGPT answered 40 of 44 (91%) and Perplexity 39 of 44 (89%), so both engines answered about 90%, a solid two-engine sample. Google had an AI Overview present on 33 of 44 queries, about 75%, though I scored organic domains, not the Overview. This is US context, one snapshot on a single date, so treat the numbers as a signal rather than a settled measurement.